
2024 Audited 990-PF (Tax Return) & Financial Statements
Transparency is one of our core values at ARDC. Thus it’s important to us that, every year, we take some time to walk through our audited financials, and to do our best to make sure they are understandable by everyone – including people who do not spend their days analyzing 990s.
With this in mind, today we are pleased to share the results of our 2024 audit, conducted by Redwitz. You can now find our 2024 audited 990-PF (tax return) and financial statements at https://www.ardc.net/about/legal/ardc-finances/.
Cash vs. Accrual
As you look at some of the comparisons below, you’ll see some items listed as cash and some as accrual.
- Accrual totals show expenses approved in a given year (such as an invoice received from a vendor or an approved grant). Ideally, these liabilities get paid within the same year that they were approved, though some may be paid in the following year.
- Cash totals show expenses that were actually paid in a given year. When the IRS calculates our required minimum 5% distribution, they are looking at these numbers.
- The 990-PF shows both cash and accrual totals, while the financial statements primarily show accrual totals in their analysis.
Grants & Gifts
The chart below outlines our grants spending over the years, starting in 2020.
| Year | Grants & Gifts (Accrual) | Grants & Gifts (Cash) |
| 2024 | $3,421,327 | $4,029,781 |
| 2023 | $6,345,764 | $5,880,342 |
| 2022 | $6,904,678 | $8,004,191 |
| 2021 | $10,798,573 | $9,247,203 |
| 2020 | $3,155,532 | $3,004,625 |
One thing that will be immediately apparent is that our grant expenditures in 2024 were lower than they were in most previous years. This reduction in spending was a conscious decision. As you can see in last year’s blog post, ARDC entered into 2024 with an excess distribution balance of about $5.2 million over our cumulated 5% requirement. While such spending is in line with our value of Generosity, such a trend runs counter to our goal of ensuring the longevity of our endowment. Thus, in 2024, we decided to target a 4.5% distribution (and landed at about 4.4%).
Though it does mean a reduction in expenditures in the short term, it’s a decision that will ideally lend itself to greater stability in the long term. We’ve had a similar target in 2025 and plan to keep it in 2026.
Statement of Functional Expenses
Functional expenses look at our overall expenses, separating the program expenses (directly related to carrying out our programs) from management and administration.
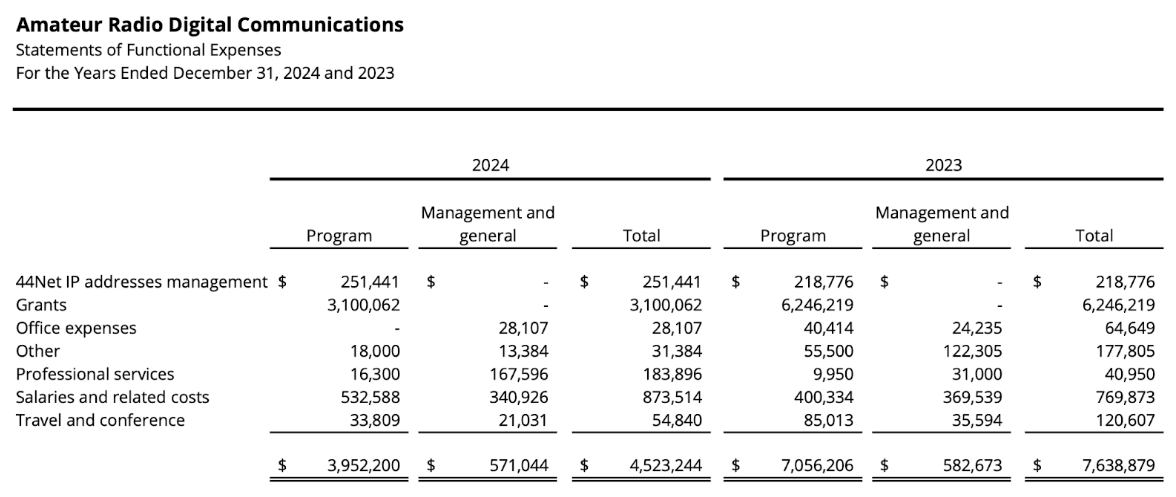
Statement of Functional Expenses, which can be seen in text format on Page 7 of our 2024 Financial Statements.
Looking at this view of our finances, you can see how different parts of our expenses directly serve our programs (44Net as well as Grants & Gifts) versus general administrative overhead. This view also provides a comparison to the previous year so that the public can see changes between years.
Total Expenses: 990-PF
Another way of looking at our expenses in 2024 is to look at the total expenses versus the grants paid as outlined in Part I of the 990-PF. Note that, in this view, operating expenses include all expenses excluding grants and gifts. So, 44Net, salaries, legal fees – all go into the Operating Expenses category.
| Accrual | Cash | |
| Operating Expenses | $1,494,359 | $1,491,521 |
| Contributions, Gifts, Grants Paid | $3,421,327 | $4,029,781 |
| Total Expenses & Contributions | $4,915,686 | $5,521,302 |
Beginning-of-Year vs. End-of-Year vs. Average Assets
Part II of the 990-PF outlines our balance sheets, which show our total assets and liabilities at the beginning and end of the year:
- Beginning-of-year: $117,236,719
- End-of-year: $128,192,418
Our month-by-month average assets are used to determine our required distribution for the year. In 2024, our average assets were $124,990,132 (see Part IX of the 990-PF).
Qualifying Distribution Balance
So where does all of this leave us in terms of our required 5% distribution balance? This information is outlined in Parts IX, X, XI, and XII of the 990-PF.
- Parts IX and X calculate the amount of our qualifying distribution (5% of our average assets minus fees like our 2024 income taxes),
- Part XI lists the qualifying distribution (same amount as the cash total of expenses in Part I), and
- Part XII outlines our remaining distributions from prior years, our minimum distribution amount for 2024, and the remainder based on our 2024 qualifying distribution. Since we spent more than required, this remainder will be carried over toward our 2024 distribution.
Here is the excess distribution calculation for 2024:
| 2024 5% Distribution Amount: | $6,411,937 |
| 2024 Qualifying Distribution: | $5,521,302 |
| 2024 Excess Distribution: | -$890,635 |
And here is how 2024’s distribution balance affects our cumulated distribution balance:
| 2021 Distribution Balance | $486,289 |
| 2022 Distribution Balance | $3,093,019 |
| 2023 Distribution Balance | $1,654,477 |
| 2024 Distribution Balance | -$890,635 |
| Total Excess Distribution | $4,343,150 |
It’s worth noting that we like having some excess distribution on the books. That said, as noted above, we entered 2024 aiming to curb our spending for a few years in service of the long-term health of our endowment.
Got questions about our 990-PF or Financial Statements? Just ask!
Please direct any questions to contact@ardc.net.